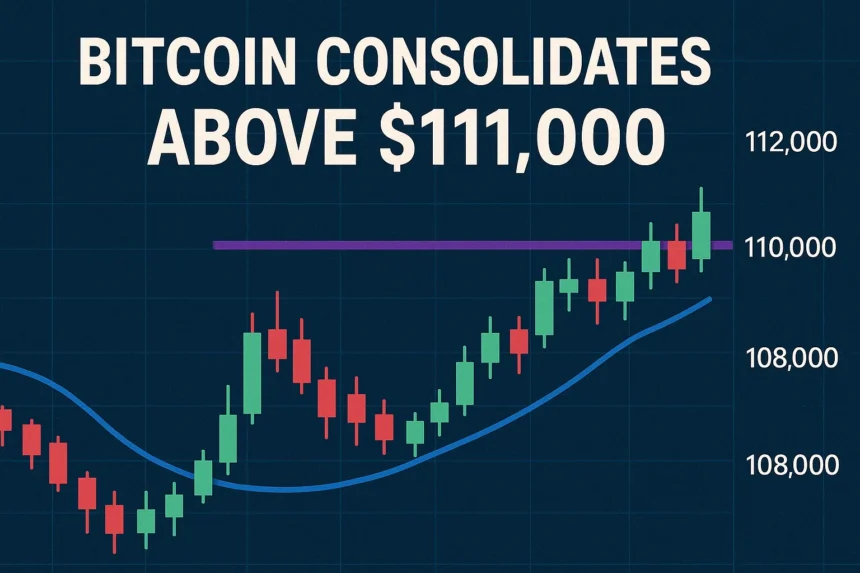
Bitcoin consolidates above $111,000, establishing a new psychological threshold that has captivated traders and investors worldwide. After reaching unprecedented heights, the world’s leading digital asset is now displaying a period of lateral price movement, creating anticipation for the next significant market catalyst. This consolidation phase represents a critical juncture where Bitcoin consolidates above $111,000 while market participants analyse technical indicators, on-chain metrics, and macroeconomic factors that could trigger the next major breakout. Understanding this consolidation pattern is essential for anyone looking to navigate the current cryptocurrency landscape and position themselves strategically for potential opportunities ahead.
Bitcoin’s Current Consolidation Pattern
When Bitcoin consolidates above $111,000, it signals a mature market digesting recent gains rather than exhibiting weakness. This sideways price action represents a healthy pause in the broader uptrend, allowing the asset to build a solid foundation for potential future movements. Lower volatility, narrower trading ranges, and a balance between buying and selling pressure characterise consolidation periods.
The current consolidation zone has formed after Bitcoin’s remarkable ascent through six-figure territory. Technical analysts identify this phase as an accumulation period where institutional investors and sophisticated traders position themselves strategically. The $111,000 level has shifted from resistance to support, a bullish technical development that suggests underlying market strength.
Key Characteristics of the Current Price Action
Several distinctive features define this consolidation phase. The trading volume has decreased compared to the explosive rally that preceded it, a typical feature of consolidation periods. Price volatility has compressed significantly, with daily trading ranges narrowing to approximately 2-3% compared to the 5-8% swings observed during the previous uptrend.
Support levels have been tested multiple times around $110,500 and $111,000, with buyers consistently stepping in to defend these zones. Meanwhile, resistance has formed around $114,500 and $115,000, where profit-taking and selling pressure emerge. This creates a well-defined range where Bitcoin consolidates above $111,000, providing clear boundaries for traders to monitor.
Technical Analysis: What the Charts Reveal
Moving Averages and Trend Indicators
From a technical perspective, Bitcoin’s position relative to key moving averages remains constructive. The cryptocurrency trades comfortably above its 50-day, 100-day, and 200-day moving averages, all of which are sloping upward—a bullish configuration. The 50-day moving average currently sits around $105,000, providing dynamic support approximately 5% below current prices.
The Relative Strength Index (RSI) on the daily timeframe has cooled from overbought territory above 70 to a more neutral range between 55 and 60. This reset in momentum indicators is healthy for sustained uptrends, as it allows the market to relieve excessive bullish sentiment without breaking down structurally. Similarly, the MACD indicator shows diminishing bullish momentum but remains in positive territory, suggesting the underlying trend remains intact despite the consolidation.
Volume Profile and Liquidity Analysis
Volume analysis reveals interesting insights about the strength of this consolidation. The declining volume during sideways price action is actually a positive sign, indicating that sellers are not aggressively distributing at these elevated levels. High-volume nodes on the volume profile indicator cluster around $111,000- $112,000, indicating strong accumulation zones where significant buying has occurred.
The order book depth analysis shows robust bid support stacked below current prices, particularly around psychological levels like $110,000 and $108,000. Meanwhile, ask liquidity above the market appears lighter, suggesting that a breakout to the upside might encounter less resistance than a breakdown would face support. This asymmetric liquidity profile favours bullish scenarios once the consolidation resolves.
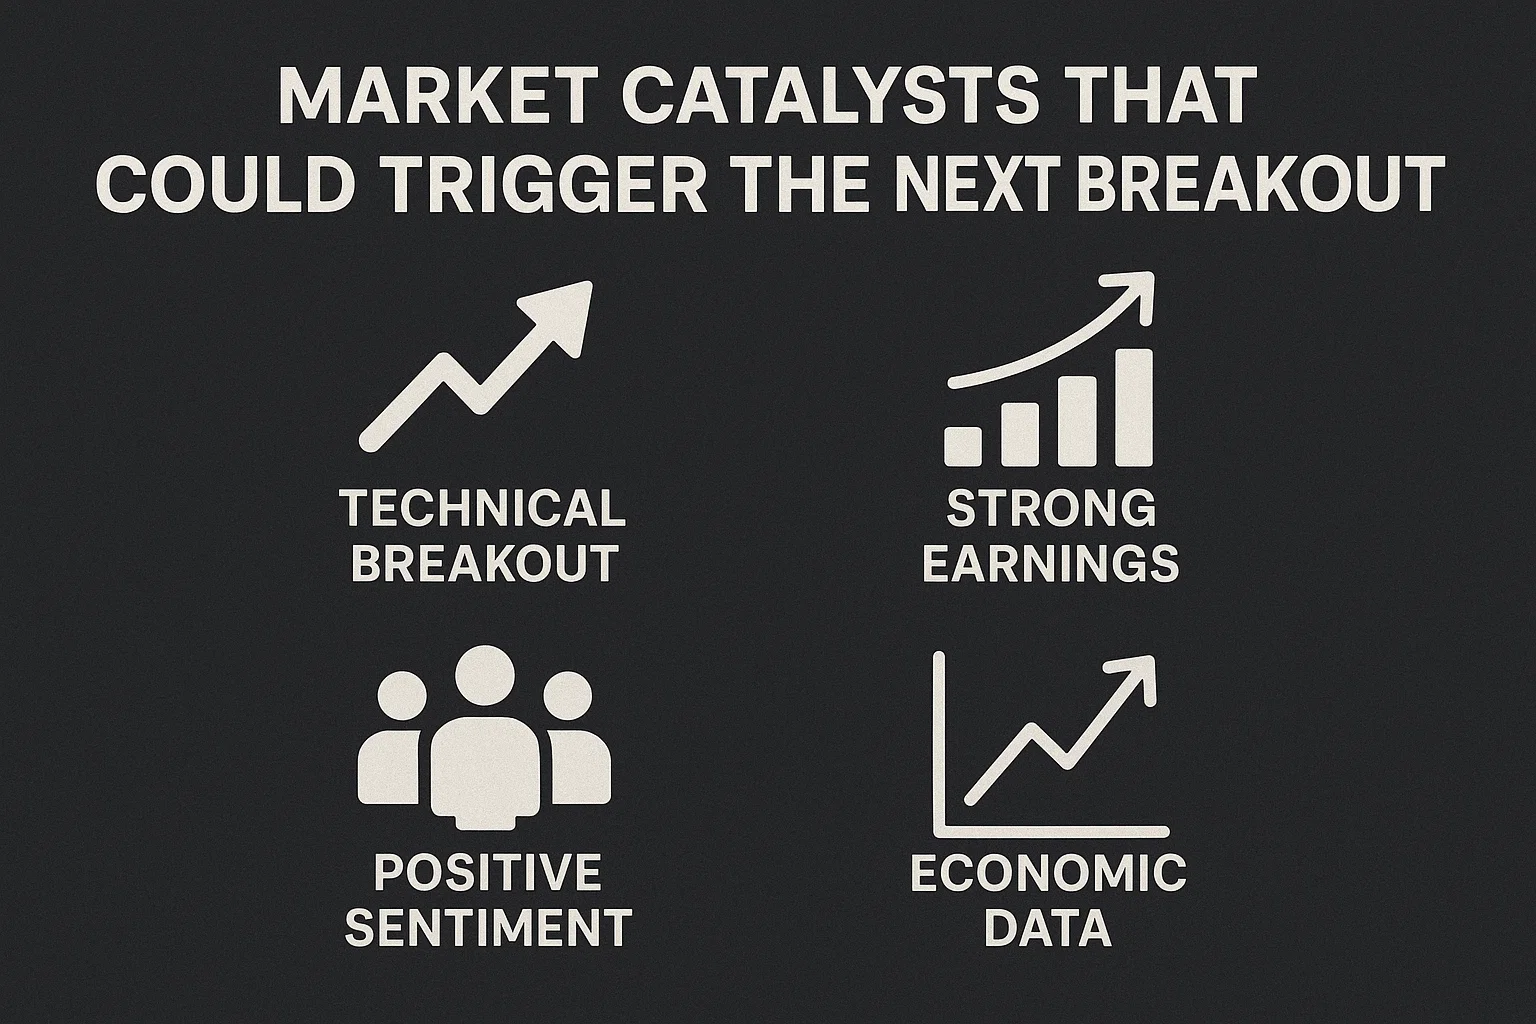
Market Catalysts That Could Trigger the Next Breakout
Institutional Adoption and ETF Flows
The institutional narrative remains one of the most potent catalysts for Bitcoin to consolidate above $111,000 and potentially higher. Exchange-traded funds (ETFs) have revolutionised access to Bitcoin for traditional investors, and their impact on price discovery cannot be overstated. Daily net inflows into spot Bitcoin ETFs remain positive overall, though they’ve moderated from the euphoric levels seen during the initial rally.
Major financial institutions have dramatically increased their exposure to digital assets. Hedge funds, pension funds, and corporate treasuries are allocating capital to Bitcoin as a portfolio diversifier and hedge against monetary debasement. This institutional demand provides a fundamental floor of support that was absent in previous market cycles, contributing to the stability observed in the current consolidation phase.
Macroeconomic Factors and Federal Reserve Policy
Macroeconomic conditions are increasingly significant in shaping Bitcoin’s price dynamics. The Federal Reserve’s monetary policy stance, inflation trends, and the performance of traditional financial markets all influence cryptocurrency valuations. As Bitcoin matures as an asset class, its correlation with broader market sentiment has evolved, though it maintains unique characteristics as a scarce digital commodity.
Interest rate expectations are particularly relevant. Should central banks signal a more dovish stance or implement rate cuts, risk assets, including Bitcoin, typically benefit. Conversely, hawkish policy rhetoric or unexpected rate increases can pressure valuations. The current environment of elevated interest rates has surprisingly not prevented Bitcoin from consolidating above $111,000, demonstrating the asset’s resilience and the strength of fundamental demand drivers.
Regulatory Developments and Policy Clarity
Regulatory clarity continues to emerge as a critical catalyst for the cryptocurrency ecosystem. Recent developments in major jurisdictions have generally favoured a constructive framework over restrictive measures. The approval and successful launch of spot Bitcoin ETFs in the United States marked a watershed moment, legitimising Bitcoin in the eyes of traditional finance.
Ongoing regulatory progress in Europe, Asia, and other regions contributes to an environment where institutional participants feel increasingly comfortable allocating to digital assets. Clear rules around custody, taxation, and compliance reduce perceived risks and lower barriers to entry for conservative investors. Any significant positive regulatory announcement could serve as the spark that propels Bitcoin out of its current consolidation range.
On-Chain Metrics: What Blockchain Data Reveals
Exchange Reserves and Supply Dynamics
On-chain analysis provides invaluable insights into market dynamics that price charts alone cannot reveal. Bitcoin exchange reserves have continued their multi-year downtrend, indicating that investors are withdrawing coins from exchanges to cold storage—a behaviour typically associated with long-term holding rather than near-term sell-ins. This supply squeeze creates favourable conditions for price appreciation when demand increases.
The percentage of Bitcoin supply that hasn’t moved in over a year has reached record highs, demonstrating unprecedented levels of holder conviction. Long-term holders are not distributing into strength, which is noteworthy given that prices have reached all-time highs. This behaviour contrasts sharply with previous cycle tops, where profit-taking from experienced holders marked local peaks.
Realised Price and Cost Basis Analysis
The realised price—representing the average cost basis of all Bitcoin in circulation—has risen to approximately $95,000. The fact that Bitcoin is consolidating above $111,000 means the market is trading roughly 17% above the average investor’s cost basis, which represents a healthy but not excessive premium. Historical data suggests that the market can sustain significantly higher multiples of realised price before entering bubble territory.
MVRV ratio (Market Value to Realised Value) currently stands at around 1.17, a moderate level that suggests room for further appreciation. During previous bull-market peaks, this metric exceeded 3.0, indicating valuations far above the average holder’s cost basis. The current reading supports the thesis that this consolidation represents mid-cycle positioning rather than late-stage exhaustion.
Miner Behaviour and Hash Rate Trends
Bitcoin miners play a crucial role in market dynamics as they represent constant supply-side pressure that must be absorbed by demand. Miner reserve balances have remained relatively stable during this consolidation phase, suggesting that mining operations are not forced into distressed selling. The hash rate—a measure of network security and miner commitment—has reached new all-time highs, demonstrating robust network fundamentals.
Miner profitability at current price levels remains extremely healthy, even for less efficient operations. This profitability creates a buffer that prevents the capitulation selling observed during bear markets when less efficient miners must liquidate holdings to cover operational expenses. Strong miner fundamentals contribute to the stability that allows Bitcoin to consolidate above $111,000 without significant downside volatility.
Comparing Current Cycle to Historical Patterns
Similarities to Previous Bull Markets
Bitcoin’s market cycles exhibit specific recurring patterns, though each cycle has unique characteristics—the current consolidation phase resembles mid-cycle corrections observed in 2013, 2017, and 2021. During previous bull runs, Bitcoin experienced multiple consolidation or correction phases that allowed late adopters to enter before subsequent rally legs pushed prices substantially higher.
The magnitude of the current move—surpassing $111,000—represents a significant percentage gain from cycle lows around $15,500 in late 2022. This approximately 600% increase is substantial but actually more modest than the 1,000%+ gains observed during the early stages of previous cycles. This suggests the market has matured, with larger market capitalisation requiring proportionally more capital to generate equivalent percentage returns.
Key Differences in Market Structure
Critical structural differences distinguish this cycle from predecessors. The presence of regulated spot ETFs represents an entirely new demand vector absent in previous cycles. These products channel institutional capital into Bitcoin with unprecedented efficiency and scale. Additionally, the regulatory environment has evolved dramatically, with clearer frameworks that have reduced uncertainty —a previously hindering factor for institutional participation.
The macro backdrop also differs substantially. Previous bull runs occurred during accommodative monetary policy with low interest rates. The current rally has materialised despite elevated rates and quantitative tightening—a testament to Bitcoin’s maturing status as an asset independent of traditional financial conditions. These differences suggest that Bitcoin consolidating above $111,000 may lead to price discovery in ranges previously unimaginable.
Trading Strategies for the Consolidation Phase
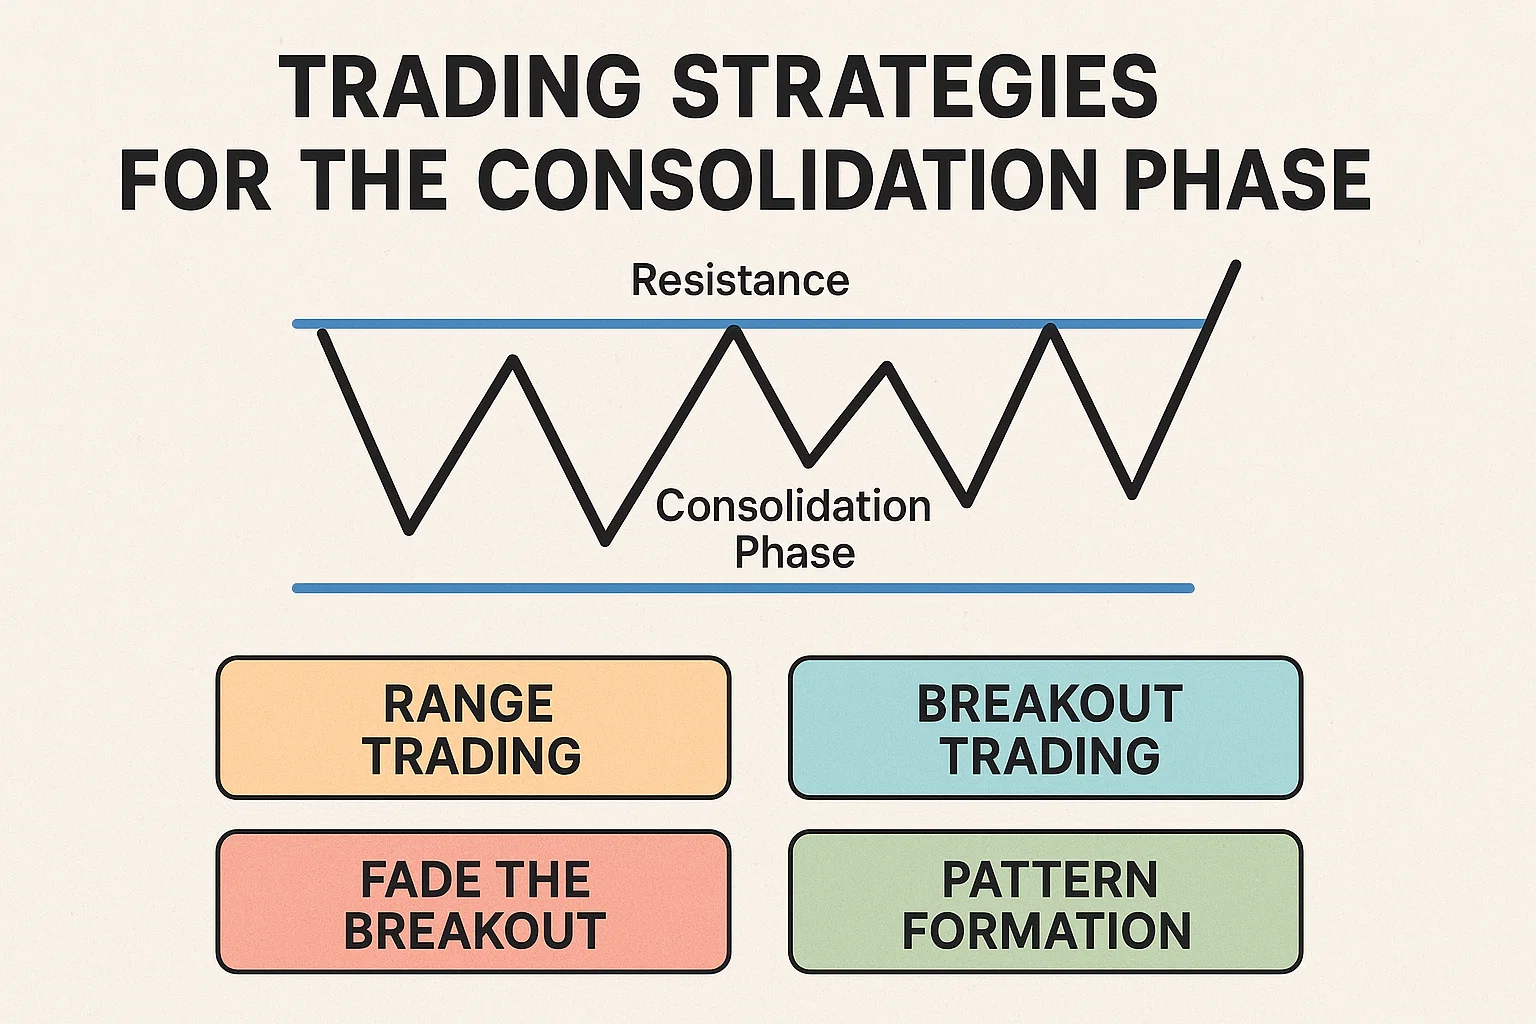
Range-Bound Trading Approaches
For active traders, consolidation phases offer distinct opportunities compared to trending markets. Range trading involves buying near support zones around $110,500-$111,000 and selling near resistance around $114,000-$115,000. This strategy requires discipline to take profits consistently and avoid holding positions that break against the range boundaries.
Risk management becomes paramount in range trading. Setting tight stop losses slightly beyond the established range boundaries helps limit downside risk if the consolidation breaks down unexpectedly. Position sizing should be conservative, as false breakouts frequently occur during consolidation phases, potentially triggering stop losses before the range re-establishes itself.
Accumulation Strategy for Long-Term Investors
Long-term investors may view this consolidation as an accumulation opportunity. Dollar-cost averaging into positions as Bitcoin consolidates above $111,000 allows investors to build exposure without attempting to time a perfect entry. This approach reduces the impact of short-term volatility and ensures participation in any subsequent breakout.
Strategic investors often use consolidation periods to rebalance portfolios and optimise their position sizes. Taking partial profits near resistance can fund additional purchases near support, effectively lowering average cost basis over time. This active management approach requires patience and discipline but can significantly enhance long-term returns compared to passive buy-and-hold strategies.
Potential Breakout Scenarios and Price Targets
Bullish Breakout Projections
Should Bitcoin break above the current consolidation range, technical analysts project several potential price targets based on measured moves and Fibonacci extensions. The immediate resistance zone lies between $114,500 and $115,000, marking the upper boundary of the current range. A decisive break above this level with substantial volume would target $118,000-$120,000 as the next significant resistance cluster.
More ambitious projections based on extension patterns suggest potential moves toward $125,000-$130,000 if bullish momentum accelerates following a breakout. These targets are derived by measuring the heights of prior consolidation ranges and projecting them upward from breakout points. Historical patterns show that consolidation breakouts often result in explosive moves that travel 1.5-2.0 times the range height.
Bearish Breakdown Considerations
While the prevailing bias remains constructive given the higher-level support structure, prudent analysis requires considering downside scenarios. A breakdown below $110,000 with sustained selling pressure could trigger stop losses and algorithmic selling, potentially leading to a test of the $105,000-$107,000 zone where the 50-day moving average and previous resistance-turned-support converge.
A more significant correction could reach toward $100,000, representing a psychologically important level and the breakout point from the previous trading range. However, such a move would likely attract substantial buying interest from investors who missed earlier accumulation opportunities. The presence of spot ETFs means any significant dip would probably be purchased aggressively by institutional allocators seeking entry points.
Global Economic Factors Influencing Bitcoin
Currency Debasement and Inflation Hedging
Bitcoin’s core value proposition as a hedge against currency debasement becomes increasingly relevant as governments worldwide continue expansive fiscal policies. Money supply growth remains elevated in major economies despite central bank efforts to tighten policy through interest rate increases. This disconnect between rate policy and money supply growth creates an environment in which Bitcoin consolidates above $111,000 as investors seek protection against purchasing power erosion.
Inflation, while moderating from peak levels, remains above central bank targets in most developed economies. Real interest rates—nominal rates minus inflation—remain either negative or barely positive in many jurisdictions. This environment favours hard assets with fixed or predictable supplies, a category where Bitcoin’s algorithmically enforced scarcity makes it uniquely attractive.
Geopolitical Tensions and Safe Haven Demand
Geopolitical instability across multiple regions has elevated interest in assets outside the traditional banking system. Bitcoin’s decentralised nature and resistance to confiscation make it attractive in regions experiencing political turmoil, capital controls, or banking system instability. While gold has traditionally served as a safe-haven asset, Bitcoin’s portability and divisibility offer advantages for modern capital preservation needs.
The weaponisation of the international financial system through sanctions and restrictions has prompted both individuals and nation-states to diversify their holdings away from assets that can be frozen or seized. Bitcoin adoption in emerging markets facing currency crises or economic mismanagement continues accelerating, creating organic demand that supports valuations regardless of speculative sentiment in developed markets.
Expert Opinions and Market Sentiment Analysis
Analyst Predictions and Consensus Views
Market analysts across the cryptocurrency ecosystem have issued varied projections regarding Bitcoin’s trajectory from current levels. Bullish analysts cite institutional adoption, supply dynamics, and macroeconomic conditions as supporting significantly higher valuations. Conservative estimates place year-end targets around $125,000-$140,000, while more aggressive forecasts suggest potential moves toward $150,000-$175,000 if adoption curves steepen.
Sceptical voices, while fewer than in previous cycles, caution about elevated valuations and potential regulatory headwinds. These contrarian perspectives provide valuable balance, reminding investors that past performance doesn’t guarantee future results and that cryptocurrency markets remain volatile despite increasing maturity. The diversity of expert opinion reflects the inherent uncertainty in predicting the timing and magnitude of future price movements.
Sentiment Indicators and Market Psychology
Sentiment analysis reveals a market psychology that could be described as “cautiously optimistic.” Unlike previous cycle peaks characterised by euphoria and extreme greed, current sentiment readings show measured confidence without excess exuberance. The Fear and Greed Index has ranged between “Greed” and “Neutral” during this consolidation phase—not reaching the “Extreme Greed” levels that often mark local tops.
Social media engagement and search volume for Bitcoin-related terms remain elevated but have stabilised rather than experiencing the parabolic increases that characterised previous speculative peaks. This suggests that while interest remains high, the market has not yet entered the FOMO (fear of missing out) phase that typically marks late-stage bull markets. The measured sentiment profile supports the thesis that Bitcoin consolidates above $111,000 in preparation for further appreciation rather than distribution ahead of a significant correction.
Risk Factors and Considerations
Market Volatility and Correction Risks
Despite the relative stability during this consolidation phase, investors must remain cognizant of cryptocurrency’s inherent volatility. Sharp corrections of 20-30% have occurred even within broader bull markets, as profit-taking, leverage liquidations, or negative news catalysts temporarily overwhelm buying pressure. Position sizing appropriate to individual risk tolerance remains essential regardless of bullish long-term outlooks.
The presence of significant leveraged positions in the derivatives market represents a potential vulnerability. Funding rates on perpetual futures contracts indicate moderate bullish leverage, creating conditions where cascading liquidations could amplify any downside moves. While this risk is manageable and typical of bull markets, it warrants monitoring, as liquidation cascades have historically led to brief but painful drawdowns.
Regulatory and Systemic Risks
Regulatory risk, while diminished from previous cycles, has not been eliminated. Unexpected policy changes in major jurisdictions could impact market sentiment and institutional participation. Investors should remain attentive to regulatory developments and understand that the legal framework surrounding cryptocurrencies continues evolving.
Systemic risks, including exchange solvency, custodial security, and infrastructure reliability, also merit consideration. While the ecosystem has matured substantially with institutional-grade custody solutions and regulated venues, the collapse of major platforms in previous downturns reminds investors to prioritise security practices, including self-custody for substantial holdings and diversification across multiple service providers.
Conclusion
As Bitcoin consolidates above $111,000, the cryptocurrency market finds itself at a pivotal moment. This consolidation phase represents not weakness but rather the market digesting substantial gains and preparing for the next significant move. The technical structure remains constructive, with Bitcoin holding well above key moving averages and support levels. On-chain metrics reaffirm holder conviction and favourable supply dynamics. Institutional adoption continues advancing, providing fundamental demand that underpins current valuations.
Multiple potential catalysts—from regulatory clarity to macroeconomic developments—could trigger a breakout from the current range. Whether you’re an active trader seeking range-bound opportunities or a long-term investor building strategic positions, understanding the dynamics of Bitcoin’s consolidations above $111,000 is essential for informed decision-making.